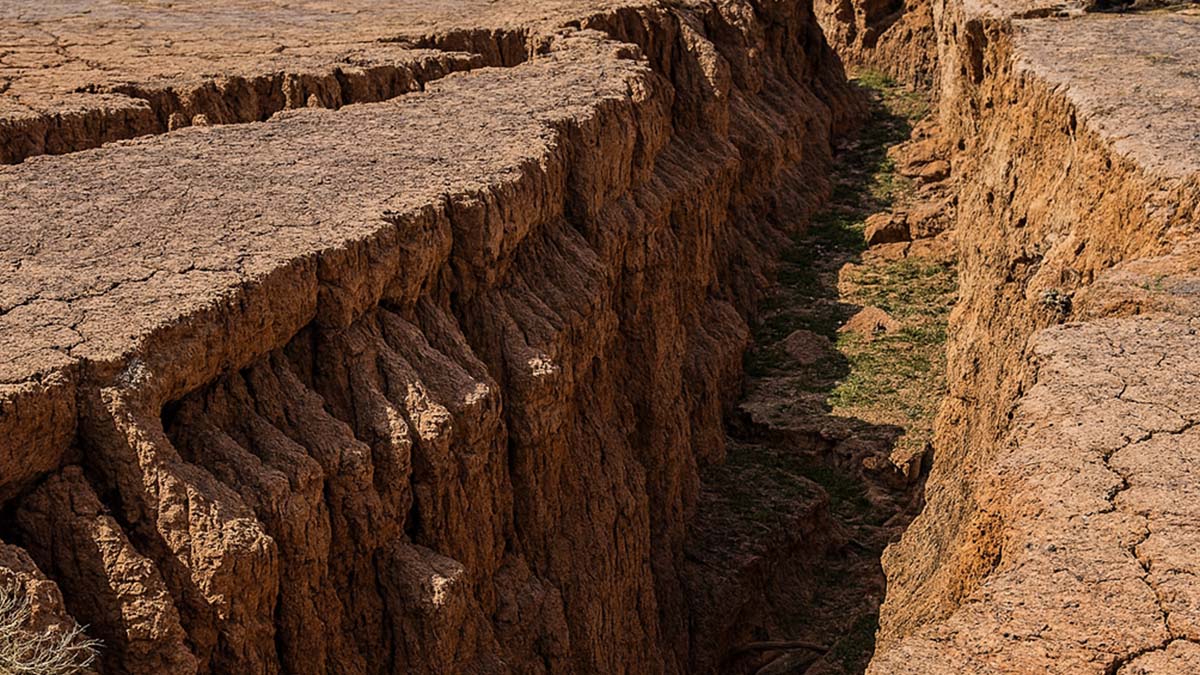
A jolt like this rarely lets us watch the ground move, yet a single camera did exactly that. The scene shows land shearing sideways, lines bending, and dust lifting as if time itself had been trimmed. In that brief window, a fault slip turned abstract theory into visible motion, so researchers could read the clues. The clip stays raw, the science stays clear, and the implications reach far beyond one shaken street.
What the camera revealed on March 28, 2025
A magnitude 7.7 event struck during Friday prayer hours on March 28, 2025. It ruptured the Sagaing Fault in central Myanmar, with an epicenter near Mandalay. According to historical records, it was the country’s strongest quake in more than a century and its second deadliest in modern times, so urgency guided every observation.
The fault was strike-slip, so blocks of crust slid past each other along a near-vertical plane. To anyone nearby, the ground looked torn along a line, while buildings and roads shifted in opposite directions. This style of motion produces sharp lateral offsets, and it often leaves crisp markers across pavements, walls, and fences after the fault slip ends.
Crucially, a nearby CCTV camera captured the rupture in real time. That vantage point turned ruin into data, because it recorded the surface breaking and racing along the line of weakness. Scientists could then analyze motion frame by frame, while standard seismic instruments kept logging vibrations from farther away.
How a fault slip becomes visible frame by frame
A team at Kyoto University processed the clip with pixel cross-correlation. The method compares tiny image patches between frames, then converts shifts in pixels into ground displacement. Because the camera never blinked, the analysis mapped motion continuously, and it revealed how the surface tore, paused, and surged as the rupture front passed.
This approach complements traditional seismology, which interprets waves recorded at distance. While stations provide crucial timing and energy, the image stream shows near-field motion that sensors often miss. Together, the datasets reduce uncertainty, because one set constrains speeds and directions while the other nails down where and when the surface actually moved.
The footage also preserves context. Poles, curbs, and shadows act as fixed references, so the math stays grounded in the scene. Researchers can validate each step against what the eye sees, then correct for lens tilt or camera shake. That workflow keeps the result transparent, and it builds trust in every number that follows.
From distant inferences to instant insight
Earlier studies inferred pulse-like behavior and curved rupture paths from far-field seismic waves. Those hints were persuasive, yet they remained indirect because stations sat many kilometers from the break. Here, the camera stood next to the action, so timing and shape moved from inference to measurement with minimal assumptions.
The analysis confirms a short, intense burst of motion racing along the fault. Jesse Kearse described it as a ripple traveling down a rug after a quick flick, which fits a concentrated slip pulse. That image resonates because people can picture the surge, while scientists can model it using constrained speeds and durations drawn from the video.
Curvature matters because a non-linear path changes how stress concentrates. The team found the fault slip path subtly curved, consistent with geological mapping on other faults worldwide. That agreement links field evidence to dynamic behavior, so hazard models can include arcs and bends rather than assuming a perfectly straight trace that rarely exists in nature.
Timing, speed, and scale of the fault slip
Numbers lock down the story. The ground shifted sideways by 2.5 meters in about 1.3 seconds, according to the Kyoto team’s frame-by-frame results. The maximum slip speed reached roughly 3.2 meters per second. Total lateral offset fits expectations for large strike-slip ruptures, yet the short duration is the key new insight.
That brief burst strengthens the case for a pulse-like rupture. Because motion concentrates in a tight packet, the strongest shaking can pass quickly, then drop. Engineers care about that shape because peak rates and short, high-intensity windows damage structures differently than longer, slower drifts with similar totals.
The finding also helps reconcile field offsets with waveform models. If motion comes in a pulse, then sensors far away record distinct arrivals while nearby points record swift jumps. With the video, timing aligns across methods, so source physics gains a firmer base. The clip, therefore, connects visible displacement to the deeper rupture process.
Why video transforms future earthquake readiness
Video-based monitoring adds a tool that is cheap, fast, and scalable. Cameras already watch streets and facilities, so footage can enrich science when quakes hit. With proper calibration, timestamps, and stable mounts, ordinary systems can record near-field kinematics while seismometers capture waves, so both streams improve shaking forecasts together.
The team did not expect such rich details, yet the dataset proved decisive because it showed onset, direction, and rate without guesswork. That clarity lets researchers benchmark models, then refine friction laws and stress conditions. As those models improve, public guidance on expected ground motion becomes sharper, and emergency plans gain practical thresholds.
Next, the researchers will run physics-based simulations to test which factors control rupture behavior. They will vary stress, geometry, and barriers, then compare outputs to the measured pattern. Their goal is simple: understand how a fault slip starts, strengthens, and stops, so cities near active faults can plan for the worst with better numbers.
Why this rare footage reshapes earthquake science going forward
A street-level lens turned a violent moment into a precise record, and that changes what science can prove. The event near Mandalay, on the Sagaing Fault, supplied hard measurements of speed, timing, and path as the fault slip raced by. Because those values now anchor models, forecasts can grow more honest, and resilience can grow more real.
