A fast-changing Pacific is set to tilt the odds this winter, and the first signals already appear on seasonal maps. Probabilities shift by region, jet streams wobble, and risk balances move as oceans cool. The pattern at stake, La Niña, often nudges the atmosphere into familiar shapes, yet never copies itself. Because the signal looks weak, experts weigh history, model trends, and long-term baselines with care, so readers get context, not hype.
What the pattern is and why the maps matter
The cool phase of ENSO lowers equatorial sea-surface temperatures and, by teleconnection, reshapes weather far from the Tropics. That shift can influence winter cold shots, storm tracks, rainfall chances, and wildfire fuels. Agencies blend this signal with longer climate trends to produce probability maps, which show odds for temperature and precipitation departures rather than deterministic day-to-day forecasts.
History still speaks here. In 2020, forecasters tied a hyperactive Atlantic hurricane season—30 named storms—to favorable background conditions, which included this cool phase. Because seasons vary, outlooks express risk, not promises. The maps highlight where the needle moves, while confidence depends on strength, duration, and competing drivers that can amplify or mute the signal.
Definitions keep expectations grounded. NOAA requires five consecutive three-month averages with sea-surface temperature anomalies at −0.5 °C or colder to declare the phase. Experts caution that this year’s cooling may stay brief or borderline. The label matters less than impacts, yet criteria help users compare events and avoid conflating short cool snaps with sustained phases.
How La Niña steers the jet stream and shapes winter flow
During fall and early winter, models often split the upper-level jet over the North Pacific. One branch arcs toward Alaska, then dips into western Canada and the northern United States, which can open the door to colder air. A separate southern storm track targets the Pacific Northwest more often, although timing and amplitude vary from month to month.
Because the split shifts downstream weather, storm frequency and temperature swings pivot by region. Where the northern branch digs, cold can bite harder; where ridging dominates, mild spells linger. Maps translate that physics into odds: they shade where above- or below-normal outcomes become likelier.
Signal strength sets the ceiling for confidence. Specialists note equatorial waters in the central and east-central Pacific continue to cool, yet the magnitude looks modest. A weaker event usually yields softer, noisier outcomes. That means local topography, short-term patterns, and random variability can still overwhelm the background signal in any single cold snap or rain episode.
Regional signals when La Niña looks weak or short-lived
When the cool phase stays muted, classic patterns still appear, only with lower amplitude. The northern tier can lean colder at times because the jet dips, while the Pacific Northwest can see more frequent systems as the southern branch aims there. However, short warm spells often cut in, so communities should plan for swings more than lockstep cold.
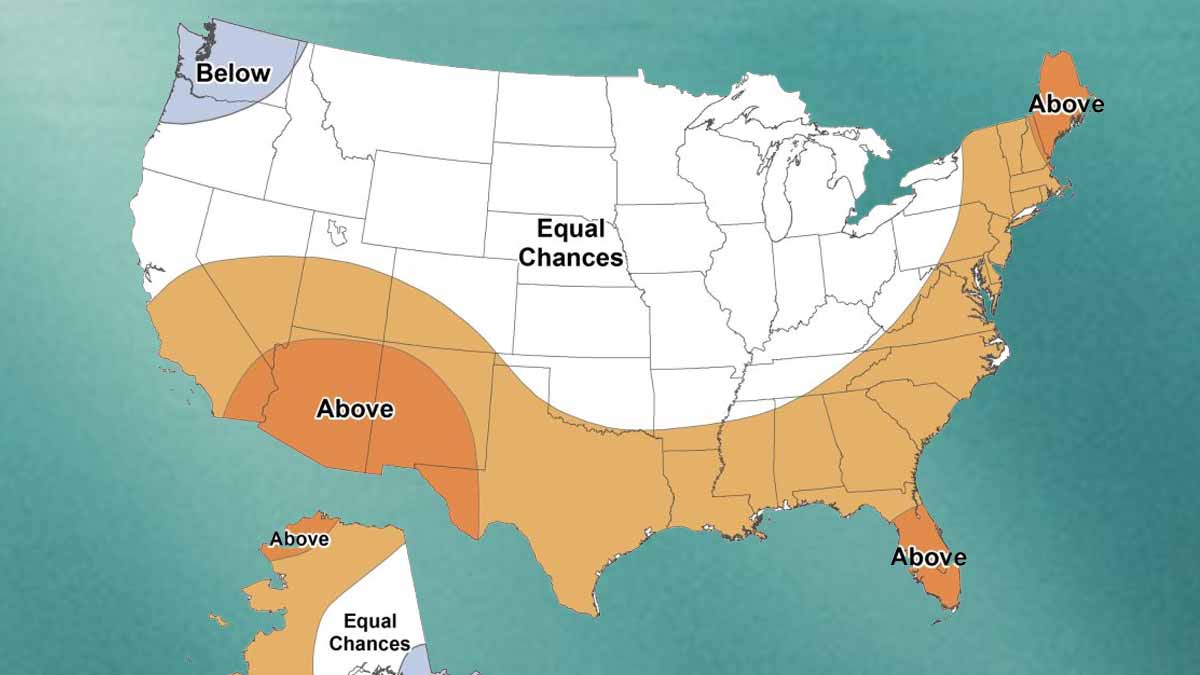
Maps for December 2025 through February 2026 tilt warm across parts of southeast California, southern Nevada, and Arizona, where probabilities rise to the 40–50 percent range for above-normal temperatures. The majority of Washington and northwest Oregon, in contrast, leans cooler than normal. Those odds communicate a nudge, not certainty, and they work best across whole seasons.
Precipitation outlooks show central California with a 33–44 percent chance of below-normal totals, with higher chances in the south. Portions of Arizona, New Mexico, and Texas also lean drier. Because seasonal totals depend on a few big storms, a single atmospheric river can still move the needle; the map expresses background tilt rather than month-by-month timing.
Reading the probability maps when the clock runs from October to January
Experts favor a brief window for onset between October and January. That timing matters because early-season ocean shifts can precondition winter patterns through feedbacks between the Tropics and the jet stream. Users should pair monthly updates with local context, since snowpack, soil moisture, and reservoir status change as events stack through the season.
Temperature probabilities work like a vote count, not a thermometer reading. A 50 percent warm-tilt region still leaves many outcomes on the table. The same logic guides precipitation, where below-normal odds across central California suggest fewer or weaker storm trains, especially to the south. Water managers, therefore, monitor both the maps and real-time storms.
Attribution helps frame confidence. CPC scientists note that precipitation outlooks often take their strongest cue from ENSO while temperature outlooks blend ENSO with long-term trends. That means the cool phase can steer storm frequency more than it sets exact temperatures, especially when the signal stays weak.
What experts say, and how to act on changing guidance
Long-range specialists, including AccuWeather’s Paul Pastelok, report cooling in the central and east-central equatorial Pacific. He cautions that the event may not meet NOAA’s threshold, which requires those five tri-monthly averages at or below −0.5 °C. Because of that, he flags uncertainty in U.S. impacts, even while the jet-split pattern remains plausible.
Model spreads explain the caution. A borderline event leaves greater room for competing influences, such as intraseasonal waves or high-latitude blocking. As those elements wax and wane, storm tracks jog, snowfall bands wobble, and warm breaks interrupt cold windows. Planning that assumes ranges, not single outcomes, handles such variability with fewer surprises.
Users should follow the cadence of updates. The Climate Prediction Center refreshes seasonal temperature and precipitation outlooks on the third Thursday each month. Because probabilities shift as new oceans and atmosphere data arrive, the maps you see today evolve with the signal. Keep an eye on regional briefings, because local offices add detail on snow, ice, and wind risks.