A hidden world emerges under the southern ice, and it changes the stakes. A new atlas maps the seafloor with a clarity that rewrites what we thought we knew. The work reveals vast structures and a complex architecture that shape water, ice, and climate. Inside this network, canyons act as critical pathways. The findings raise urgent questions about ocean circulation, melting from below, and future sea-level rise.
A continent-wide map that resets the baseline
The atlas compiles high-resolution bathymetric data from more than 40 expeditions. Teams built the first standardized map across the entire Antarctic margin, which reduces gaps and improves consistency. Collecting sonar beneath floating ice shelves remained hard, so many features stayed hidden.
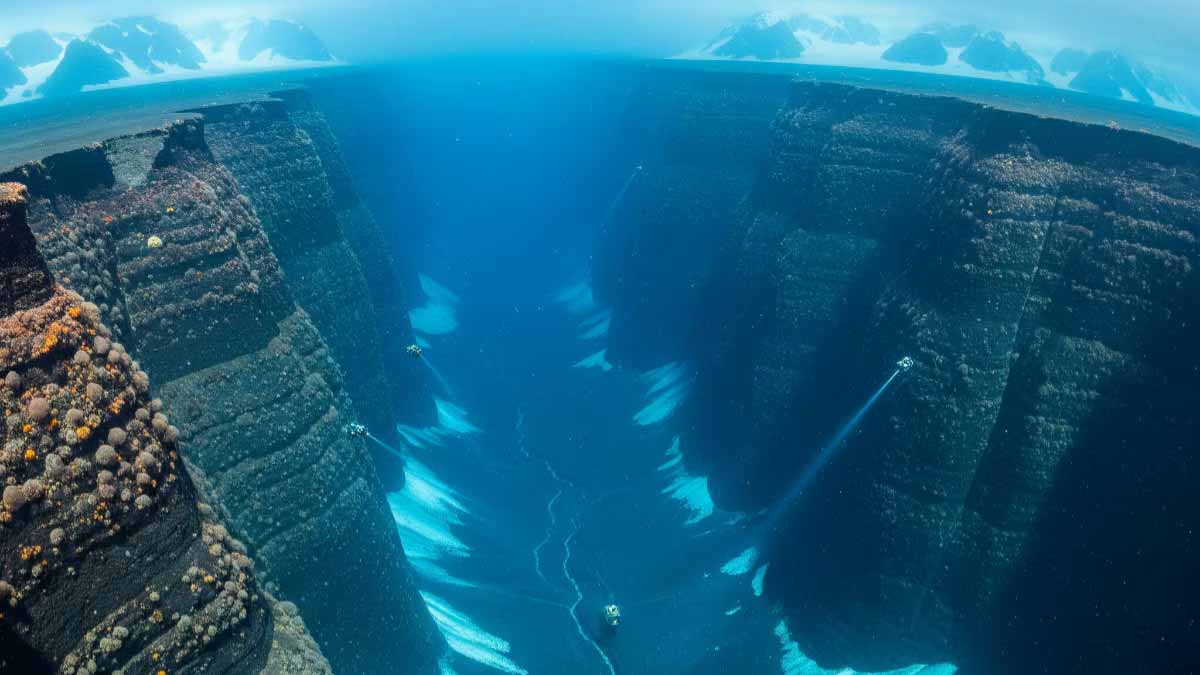
Now, researchers identify 332 previously unmapped underwater valleys. Some plunge beyond 4,000 meters. They channel sediments, nutrients, and water between the shelf and the deep ocean. Their size and complexity rival the planet’s largest submarine systems.
“We now have a coherent view across the Antarctic margin,” said Dr. David Amblàs. The map, published in Marine Geology and led by the University of Barcelona with University College Cork, offers the most detailed view to date. It sets a new reference for future surveys, modelers, and risk assessors who need accurate topography to trace water and heat.
How canyons steer Antarctic waters
These features act like conduits that link the shelf to the abyss. Dense, salty water forms on the shelf and sinks along the slopes, then flows into the deep Southern Ocean. That movement helps drive thermohaline circulation, which regulates global temperature patterns and nutrient delivery.
At the same time, warm deep layers can climb upslope through the canyons. That upslope flow reaches under ice shelves and accelerates basal melting. The exchange sets how heat meets the ice and how fresh melt escapes into the ocean.
As Dr. Alan Condron explains, the process is central, not marginal. It controls how quickly heat penetrates vulnerable ice and how efficiently the system vents the resulting freshwater. Understanding this exchange matters because small changes in pathways can change melt rates. Those changes then ripple through currents and alter climate feedbacks far from Antarctica.
Two Antarctic stories written in the seafloor
The atlas shows a strong contrast between East and West. In the east, networks are branched and extensive, with tributaries that feed a main path. That pattern points to a long, stable history under persistent ice sheets.
In the west, valleys appear steeper, straighter, and shorter. The shape fits more episodic and recent glacial activity. Models that show West Antarctica as more dynamic, and more exposed to rapid change, align with this geometry.
Researchers use these differences to refine timelines of ice flow. As Dr. Condron notes, the structure helps “reconstruct the ice flow history,” so teams can test how fast change might unfold. The shapes also set how water can move now. That is why the west, with its straighter routes, may channel heat more directly. Those pathways, and the canyons that define them, raise the risk of faster retreat under warming.
Feeding models with canyons detail changes projections
Many climate models once treated the Antarctic seafloor as smooth. That simplification muted how topography shapes currents, sediment, and ice–ocean contact. The new atlas changes the inputs. Scientists can now add shape, depth, orientation, and connectivity to simulations.
With better geometry, models can estimate where warm water will reach the shelf and how meltwater will spread. They can also test how quickly inland ice loss might reach the ocean and raise seas. This step matters because cities plan on timelines, not generalities. When models capture real channels and thresholds, risk estimates improve.
The atlas also supports process studies that track mixing and stratification in key sectors. Because the network is standardized, teams can compare regions on equal terms. That uniformity will help target field campaigns and reduce uncertainty where it is largest for policy.
What this atlas unlocks for past and future change
Beyond near-term risks, the map opens a window on deep time. The seafloor preserves traces of ice and ocean dynamics over millions of years. By pairing this geometry with cores and geophysics, researchers can refine the chronology of advances and retreats. That work clarifies how the system responded to past warming.
It also tests thresholds that could matter now. The atlas highlights where data remain thin, especially under large shelves. Future missions can focus on those gaps with autonomous vehicles and improved sonar.
Teams will also tie circulation models to biological pathways, since nutrients and carbon move along these routes. Because the canyons organize both heat and life, filling the blind spots will pay off twice. The project sets a foundation for a sustained, international effort that links mapping, modeling, and decision-ready forecasts.
Why this matters now for oceans, cities, and choices
The map does more than redraw lines on the seafloor. It points to how heat can reach ice faster, and how fresh water can change density layers. Those shifts can slow, or at times speed, the global overturning.
They also influence regional weather patterns and marine ecosystems. Coastal planners need clear, defensible numbers on sea-level rise. With this geometry, teams can test rates of loss tied to specific pathways and thresholds.
The atlas also frames a practical to-do list: instrument key routes, monitor shelf formation events, and observe melt plumes. Because the network spans the entire margin, collaboration becomes easier. Shared standards mean results compare cleanly. As data flow into models, early warnings should arrive sooner. That lead time helps communities act before small changes become locked in.
A forward-looking takeaway about risks, maps, and momentum
This atlas reveals structure that will shape choices for decades. With a clearer view of canyons, scientists can track how heat moves, how ice responds, and how seas may rise. The work lays out where to measure, what to simulate, and when to expect change. It also shows why details matter. When paths are real, forecasts gain power, and decisions gain time.
I’m betting that THESE scientists parents wish they hadn’t wasted all their money on educating halfwits.
Do you have a clue what is being discussed? Hopefully you aren’t one of the idiots who won’t understand Anthropogenic Rapid Global Climate Warming is a real thing that will mess up everything.
Lol oh my God we only have 10 years left before cities are under water lol. In the 90’s WE ONLY HAVE 10 YEARS LEFT in the 2000s WE ONLY HAVE 10 YEARS LEFT in the 2010s WE ONLY HAVE 10 YEARS LEFT in the 2020s WE ONLY HAVE 10 YEARS LEFT meanwhile pelosi obummer etc all the lefty climate change elites have all recently bought 10 plus million dollar homes on the ocean seems like a stupid investment they will be under water in 10 years uhm 🤔 🤣 billy gates the vaccine specialist says he buys carbon offsets 🤣 so he doesn’t have to stop contributing to global warming 🤣 be scared be very scared also dont forget to get your 5th vax and 10th booster hurry 🤣
🏆🏆🏆🏆🏆💋
I appreciate this and thank you for your hard work 🙏 we are Blessed
I am amazed at this discovery and scientific study assessment . The possible impact on climate change melting ice and rising of sea levels due to the gigantic system of underwater canyons . truly great shared knowledge! Thank you scientists!
Second post: extraordinary discovery grateful thanks for this sharing !
Look at the rings on Poliskie face she will be gone in less than 2 yrs along with the rest of you squirrels.